One tap before they leave. A score for every counter.
Stand a tablet at the counter or the exit. Customers tap one of five faces on their way out, and the rating is matched to the ticket that counter just served. The satisfaction report then shows which counters, services and hours your customers rate highest, and whether long waits are pulling scores down.
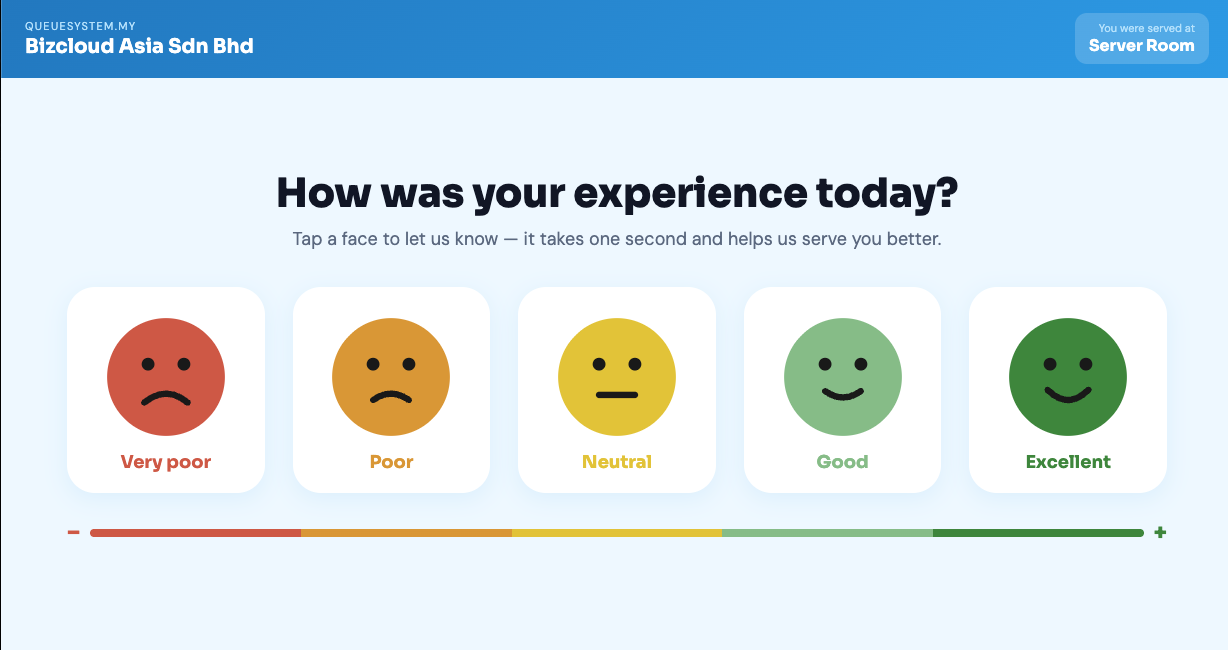
Open a link, stand the tablet up, read the report
Nothing to install and no customer details to collect. The screen runs all day on its own.
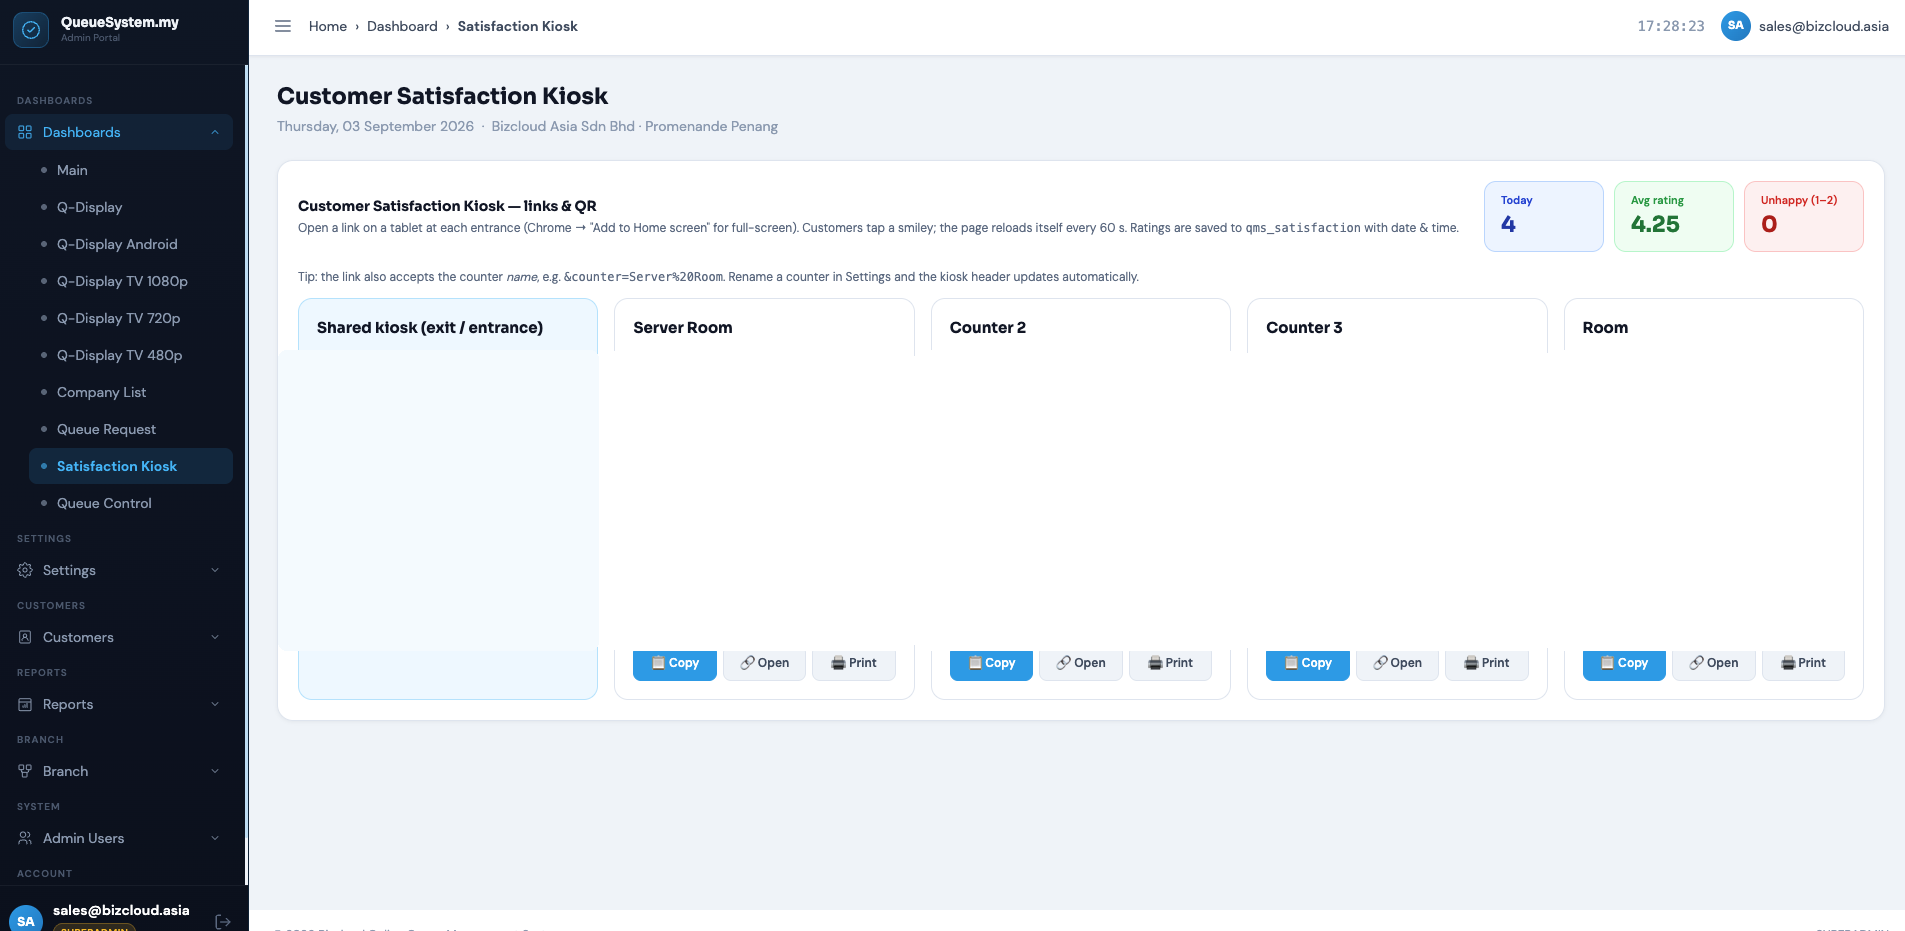
Copy the link for a counter
The portal generates one link and QR code per counter, plus a shared one for the exit. Copy it, open it, or print the QR.
Customers tap a face
Open the link on any tablet or spare phone at the counter. Customers tap, see a thank-you, and the screen resets.
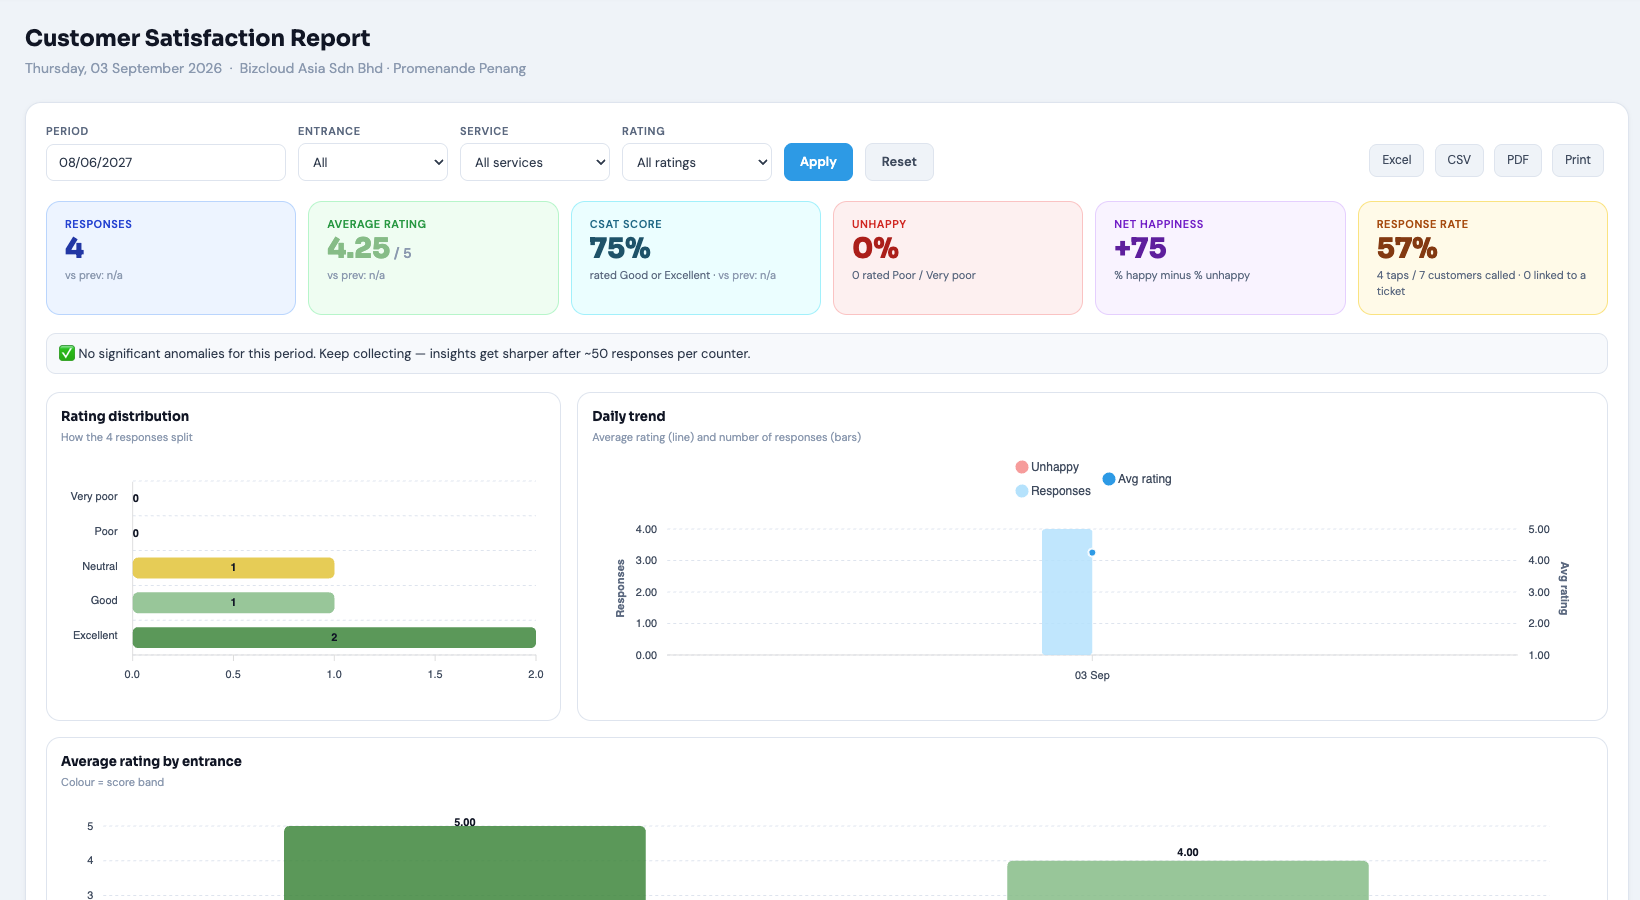
Read the satisfaction report
Scores by counter, service, day and hour appear in the portal, filtered by period and exportable for management.
Five faces, large enough to tap on the way past
The screen asks one question and offers five answers. No form, no typing, no name. A tap records the rating and the time, thanks the customer, and is ready for the next person within seconds.
- Runs in the tablet browser, no app to install
- Refreshes itself every minute and keeps the screen awake
- Shows your company name and the counter the customer was served at
- Responses are anonymous
One link per counter, or one for the exit
The portal lists a card for every counter with Copy, Open and Print buttons. Give each counter its own tablet and every rating is matched to the ticket that counter just served. Prefer a single tablet by the door? The shared link gives you an overall score without the per-counter detail.
- Printable QR code for each counter
- Rename a counter in Settings and the kiosk header updates
- Today's responses, average rating and unhappy count shown on the same page
- Add the link to the tablet's home screen for a full-screen kiosk
From a row of taps to a score you can act on
Filter by period, counter, service or rating. Every headline number is compared with the previous period so a change stands out.
Six numbers that tell you how the day felt
Responses, average rating, CSAT (share rated Good or Excellent), unhappy share, net happiness and response rate against customers called. Underneath, plain-language insights flag the best and weakest counter and the toughest hour.
- Compared with the previous period
- Rating distribution and daily trend
- Average rating by counter
- Export to Excel, CSV or PDF, or print
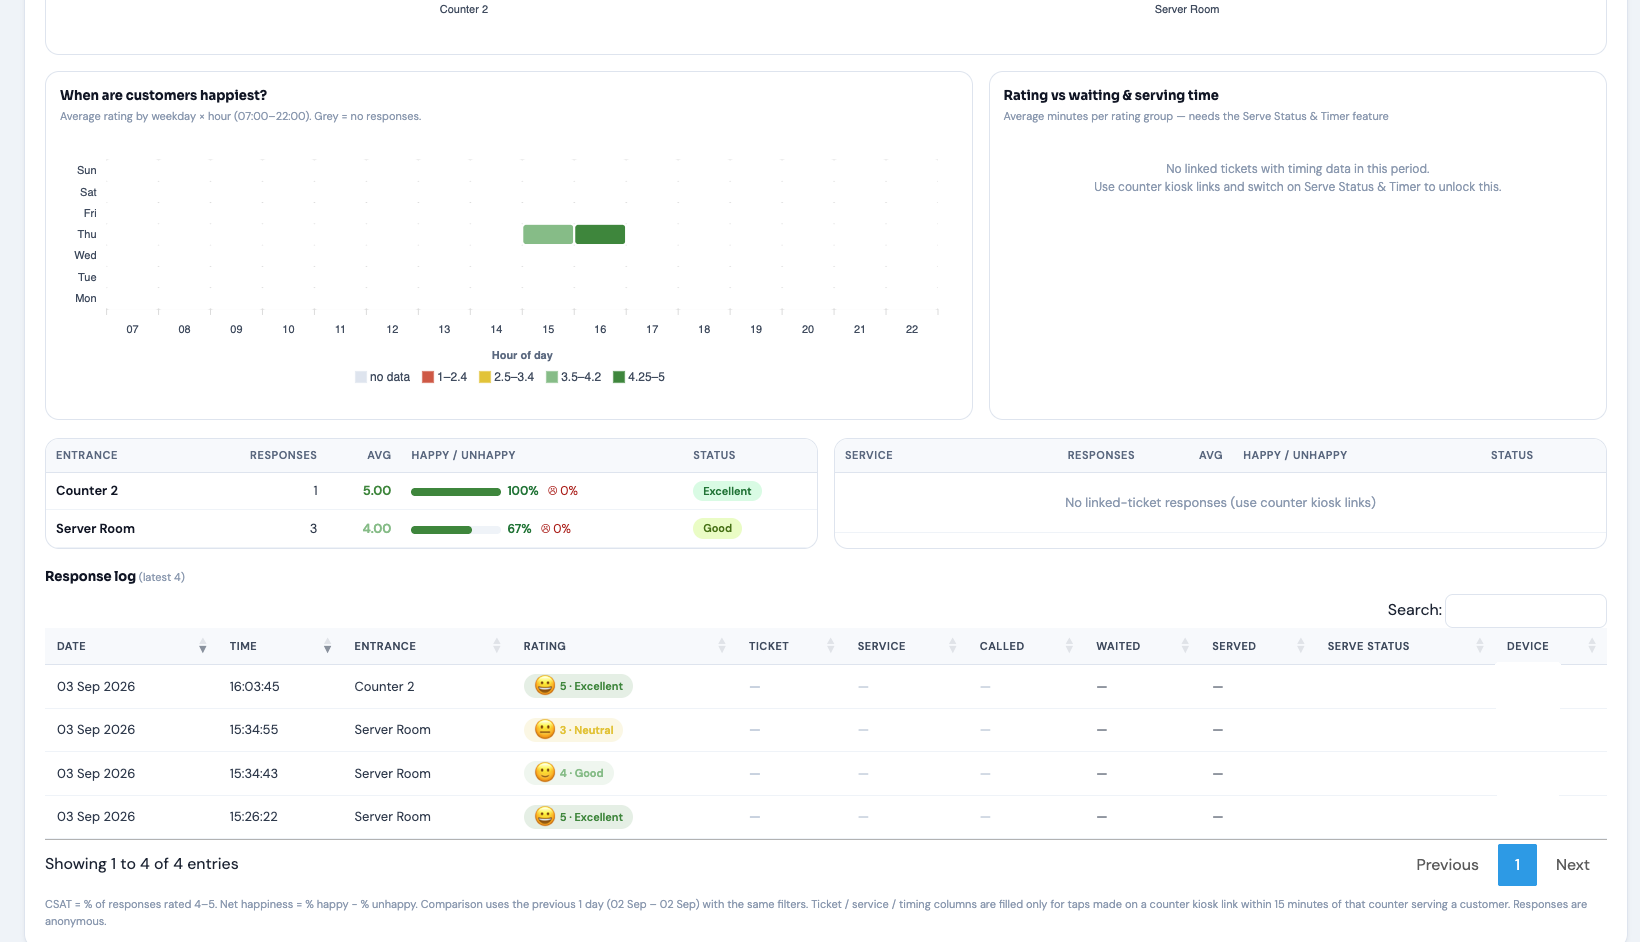
Heatmap, scorecards and the response log
See which weekday and hour scores lowest, rank counters and services with a colour status, and open every individual tap with its ticket, service and timings.
| Section | What it shows |
|---|---|
| Headline scores | Responses, average rating, CSAT %, unhappy %, net happiness and response rate, each compared with the previous period. |
| Automatic insights | Plain-language findings: best and weakest counter, happiest and toughest hour, and whether long waits are pulling scores down. |
| Rating distribution | How the responses split across Very poor, Poor, Neutral, Good and Excellent. |
| Daily trend | Average rating and number of responses, day by day. |
| Counter & service scores | Ranked scorecards with a colour status for every counter and every service. |
| Happiness heatmap | Average rating by weekday and hour, so a lunch-hour dip is visible at a glance. |
| Rating vs time | Average waiting and serving minutes for happy versus unhappy customers. Needs the Serve Status & Timer feature. |
| Response log | Every tap with its date, time, counter, rating and, when linked, the ticket, service and timings. Export to Excel, CSV or PDF. |
Does faster service make customers happier? Now you can check.
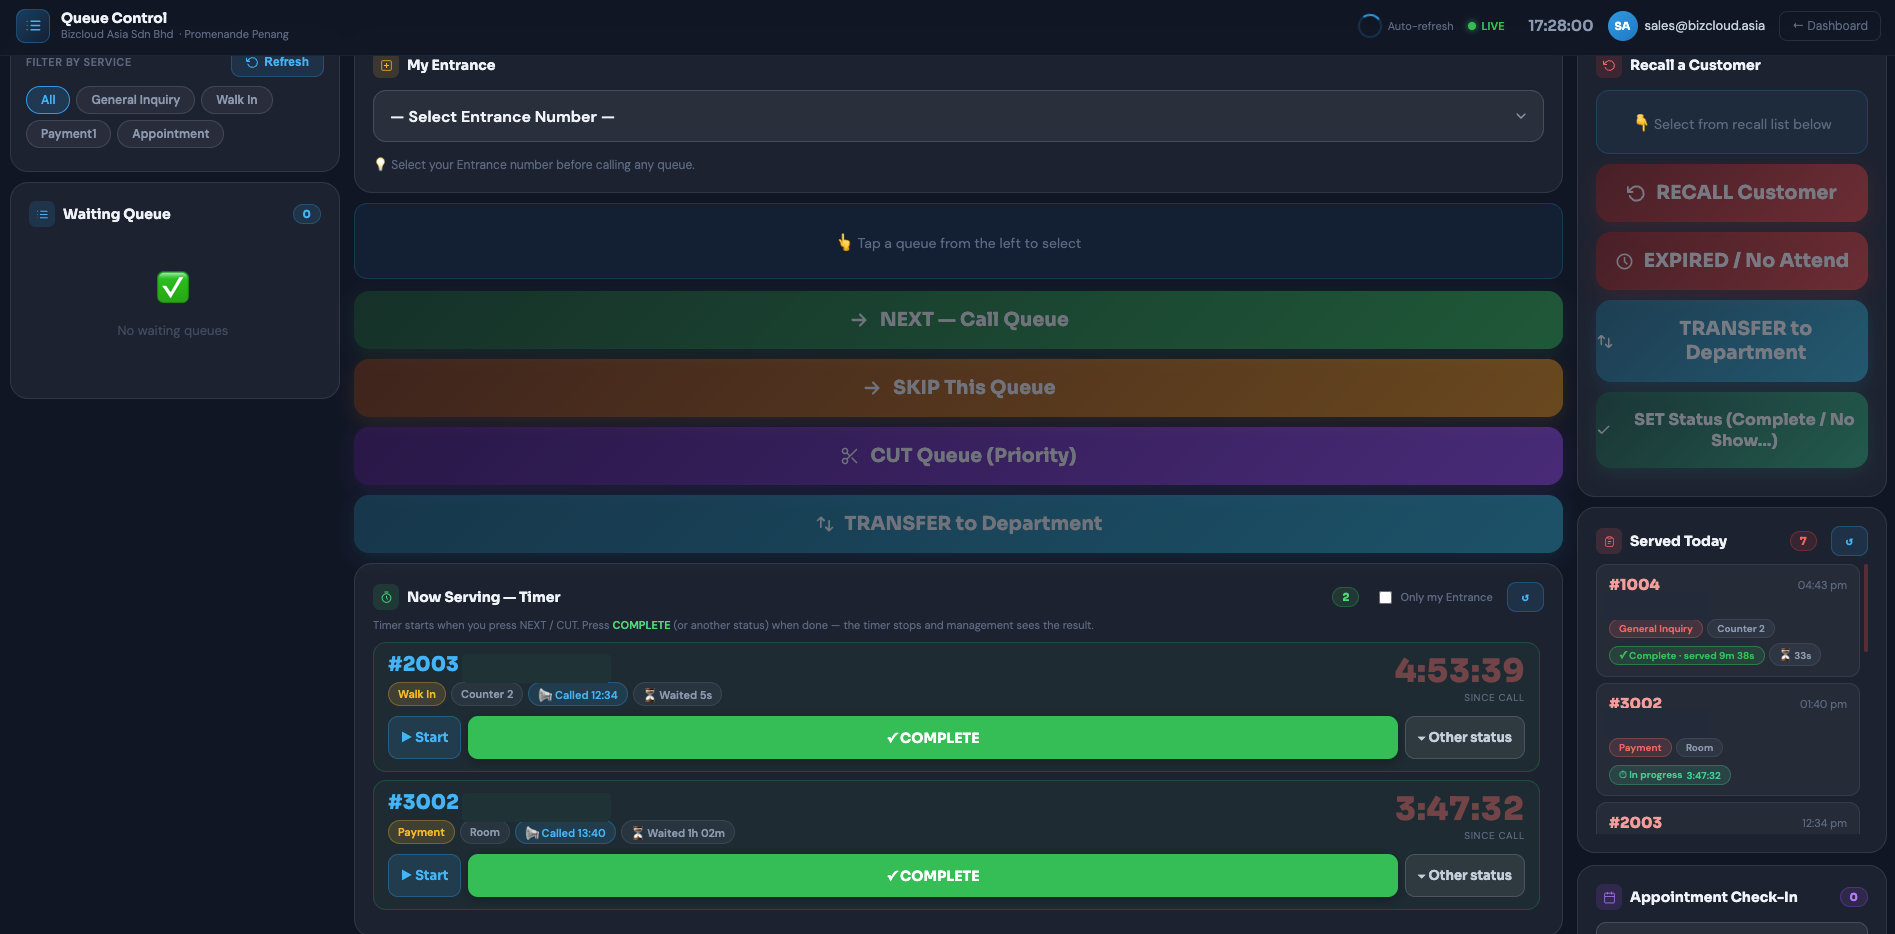
When the serve timer is on in Queue Control, every linked rating carries the waiting and serving minutes behind it.
Happy and unhappy customers, by the minutes they waited
The report's rating-vs-time panel compares average waiting and serving minutes for happy customers against unhappy ones. When the two are far apart, the queue is the problem; when they are close, look at the counter instead.
- Timer starts when staff press NEXT or CUT in Queue Control
- One tap to Complete, or mark No Show or Cancelled
- Waiting and serving time recorded on every ticket
- Serve Status Report by service and counter, exportable
A worked example
Counter 2 averages 3.4 while Counter 3 averages 4.6. The happiness heatmap shows the gap widens between 12:00 and 14:00.
The Serve Status Report shows waiting time at Counter 2 doubles in that window because one staff member covers lunch. One rota change later, the score recovers, and next month's data shows it.
What managers use it for
Catch a bad day while it can still be fixed, rather than reading about it in a review next week. Recognise the counters customers rate highest, with evidence.
Turn service quality into a number tracked monthly, per branch, and show it to head office or clients instead of estimates.
Satisfaction kiosk questions
Does the kiosk need an app or a login?
No. Open the kiosk link in the tablet's browser and it is ready. For a full-screen kiosk, add the link to the tablet's home screen. There is no login on the customer-facing screen.
Does it collect customer details?
No. Responses are anonymous. A tap records the rating, the time and the counter link it came from.
How does a rating get linked to a ticket?
Each counter has its own kiosk link. A tap on that link is matched to the ticket that counter served most recently, so the rating carries the service type and, with the timer feature on, the waiting and serving time.
Can we use one tablet at the exit instead of one per counter?
Yes. Use the shared link for an overall score. Per-counter links are only needed when you want counter, service and timing detail in the report.
What hardware do we need?
Any tablet or spare phone with a browser. A stand at the counter helps. The page keeps the screen awake and reloads itself, so it can run all day unattended.
Is it an extra charge?
It is included with Cloud QMS and WhatsApp QMS. It is switched on per company from the portal settings and changes nothing for branches that leave it off.
Start collecting ratings this week
Tell us how many counters you run and whether you want one tablet per counter or one at the exit. We switch the feature on and send you the links.